PointCast: One World Model for Rigid, Articulated, and Deformable Object Manipulation
Abstract
World models are useful for robotic manipulation because robots can predict how actions change the states of objects before executing them. We present PointCast, a point-set world model that spans rigid, articulated, and deformable object manipulation. Its state is a set of 3D points on the object and the end-effector, mesh-free and topology-agnostic. Each point keeps its identity and is supervised on its own trajectory, which teaches the model where every point goes rather than only the shape the points form. Its backbone is a diffusion transformer that denoises a short window of future point positions, conditioned on the points' recent history and the commanded end-effector motion. The backbone's attention alternates between local and global, and cross-attention to the end-effector carries the coupling. This one architecture at 19.8M parameters, one training recipe, and one checkpoint per regime cover rigid objects, cloth, rope, and multi-joint cabinets. Trained on randomized simulation and scored against four baselines on the same metric, it is best on three of four regimes and second on rigid. Trained on a real-world robot teleoperation dataset, it has the best mean in four of its six categories, is second in the other two, and improves on the dataset's own model in all six. Zero-shot, its simulation checkpoints are best on two of four captures. Frozen inside sampling-based model-predictive control at one network evaluation per window, it plans four simulated tasks over 64 episodes, competitive with or outperforming every baseline on each.
Method
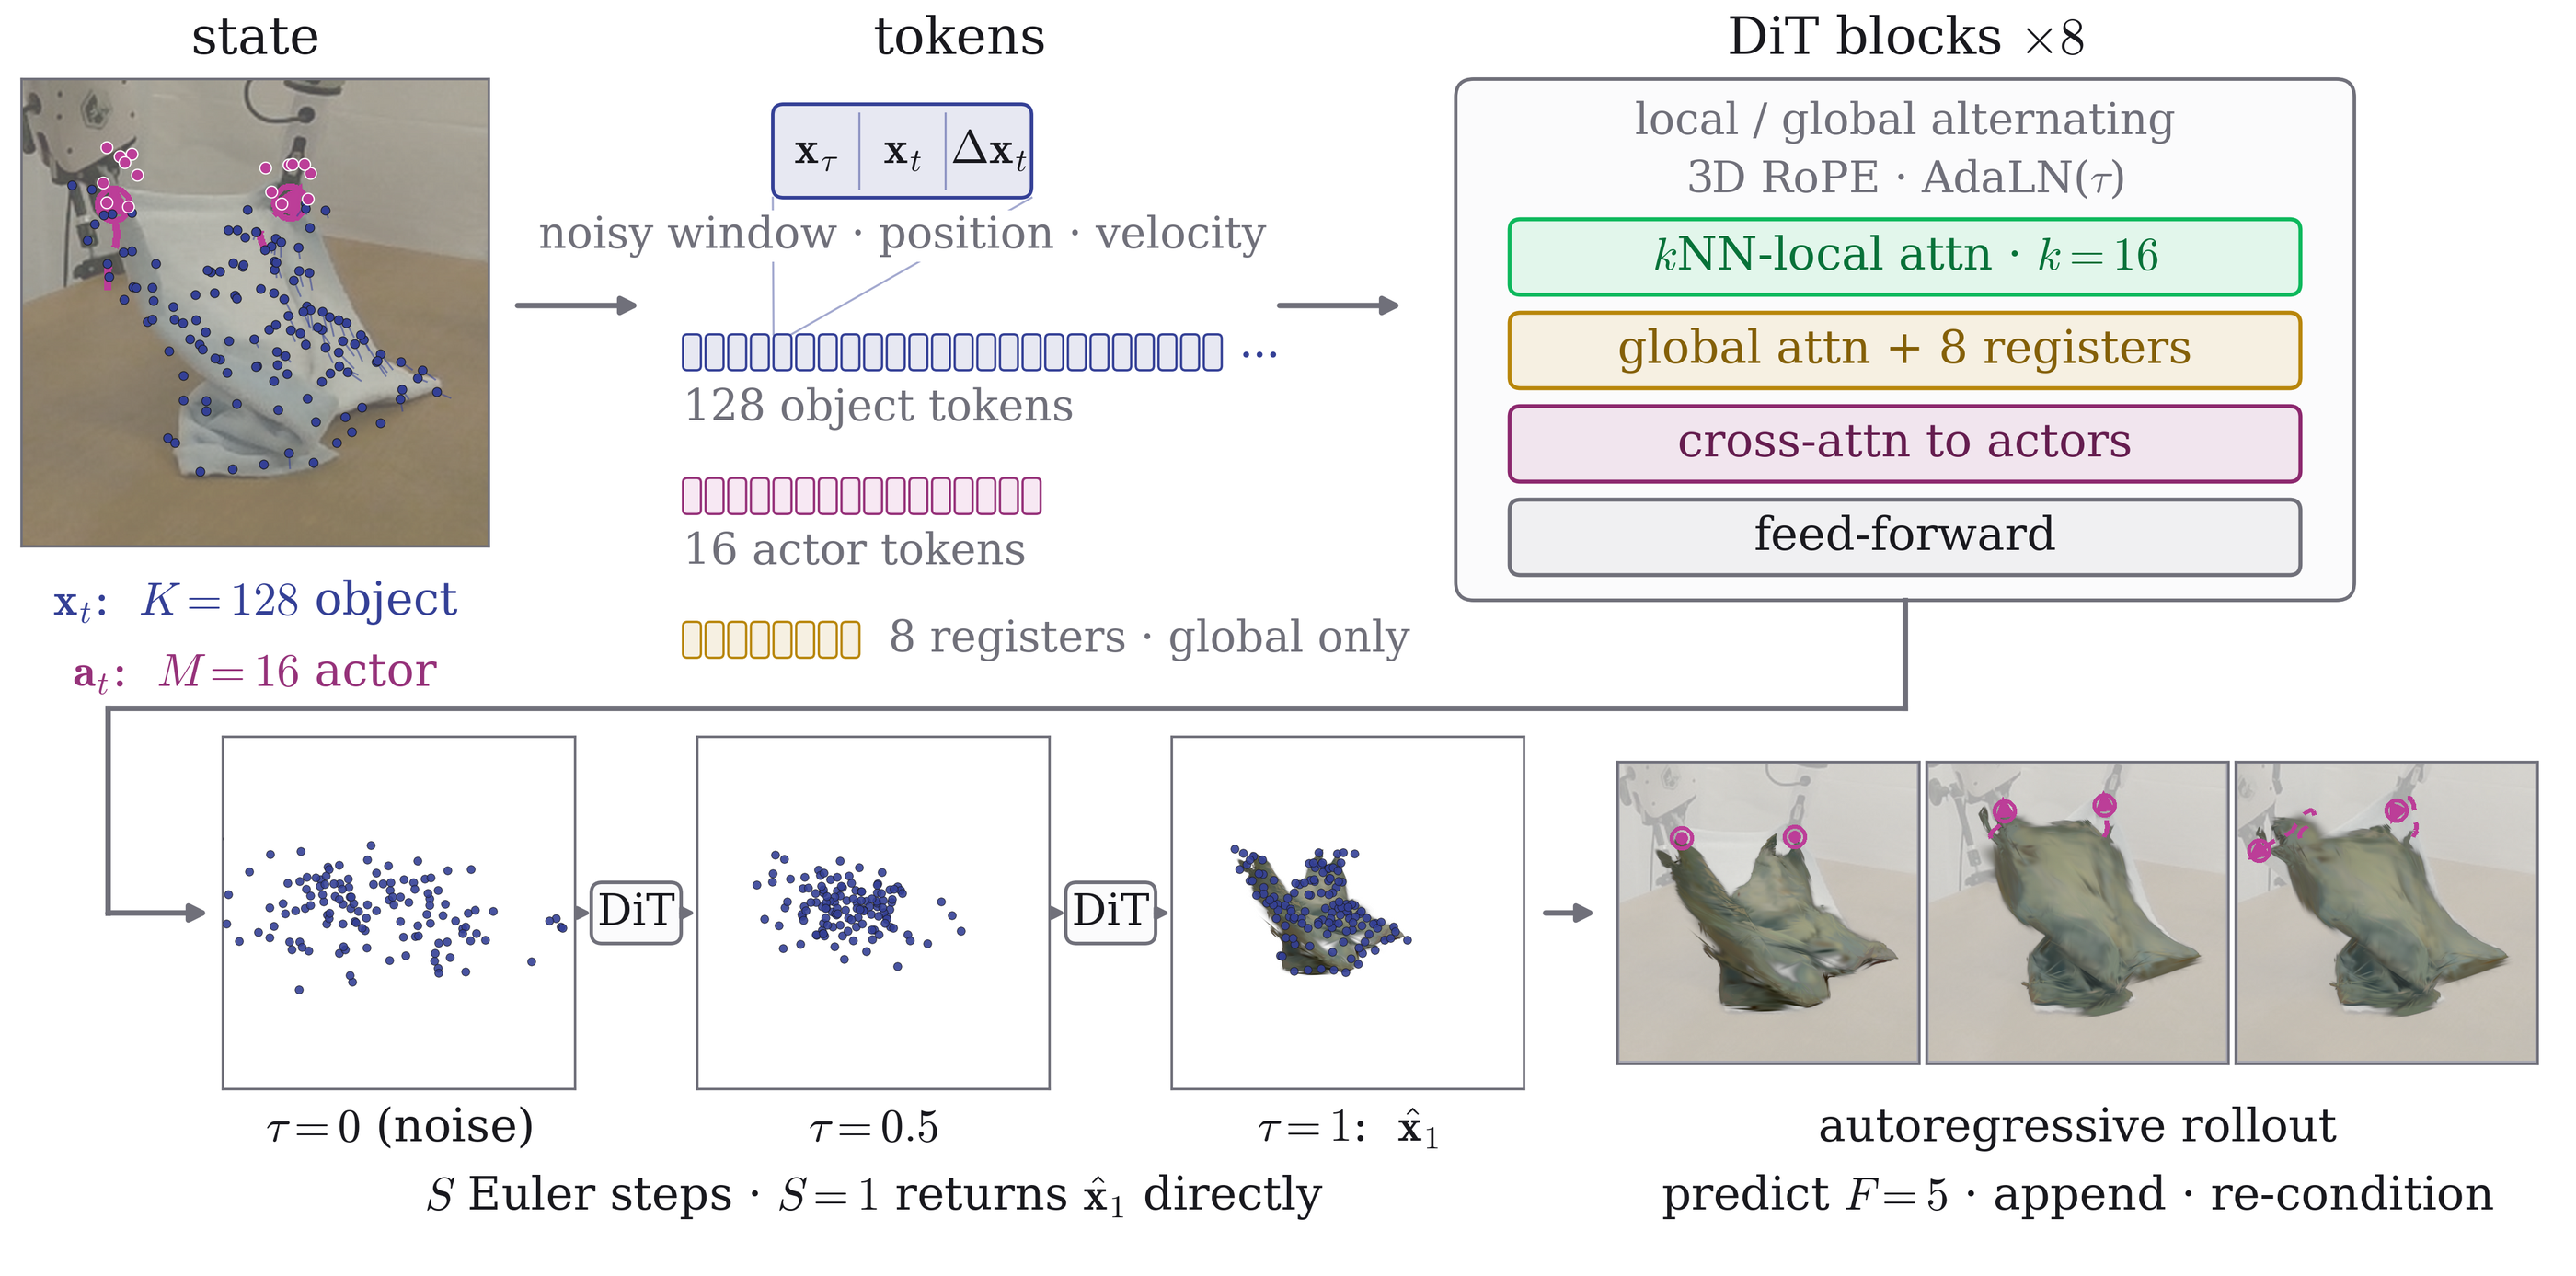
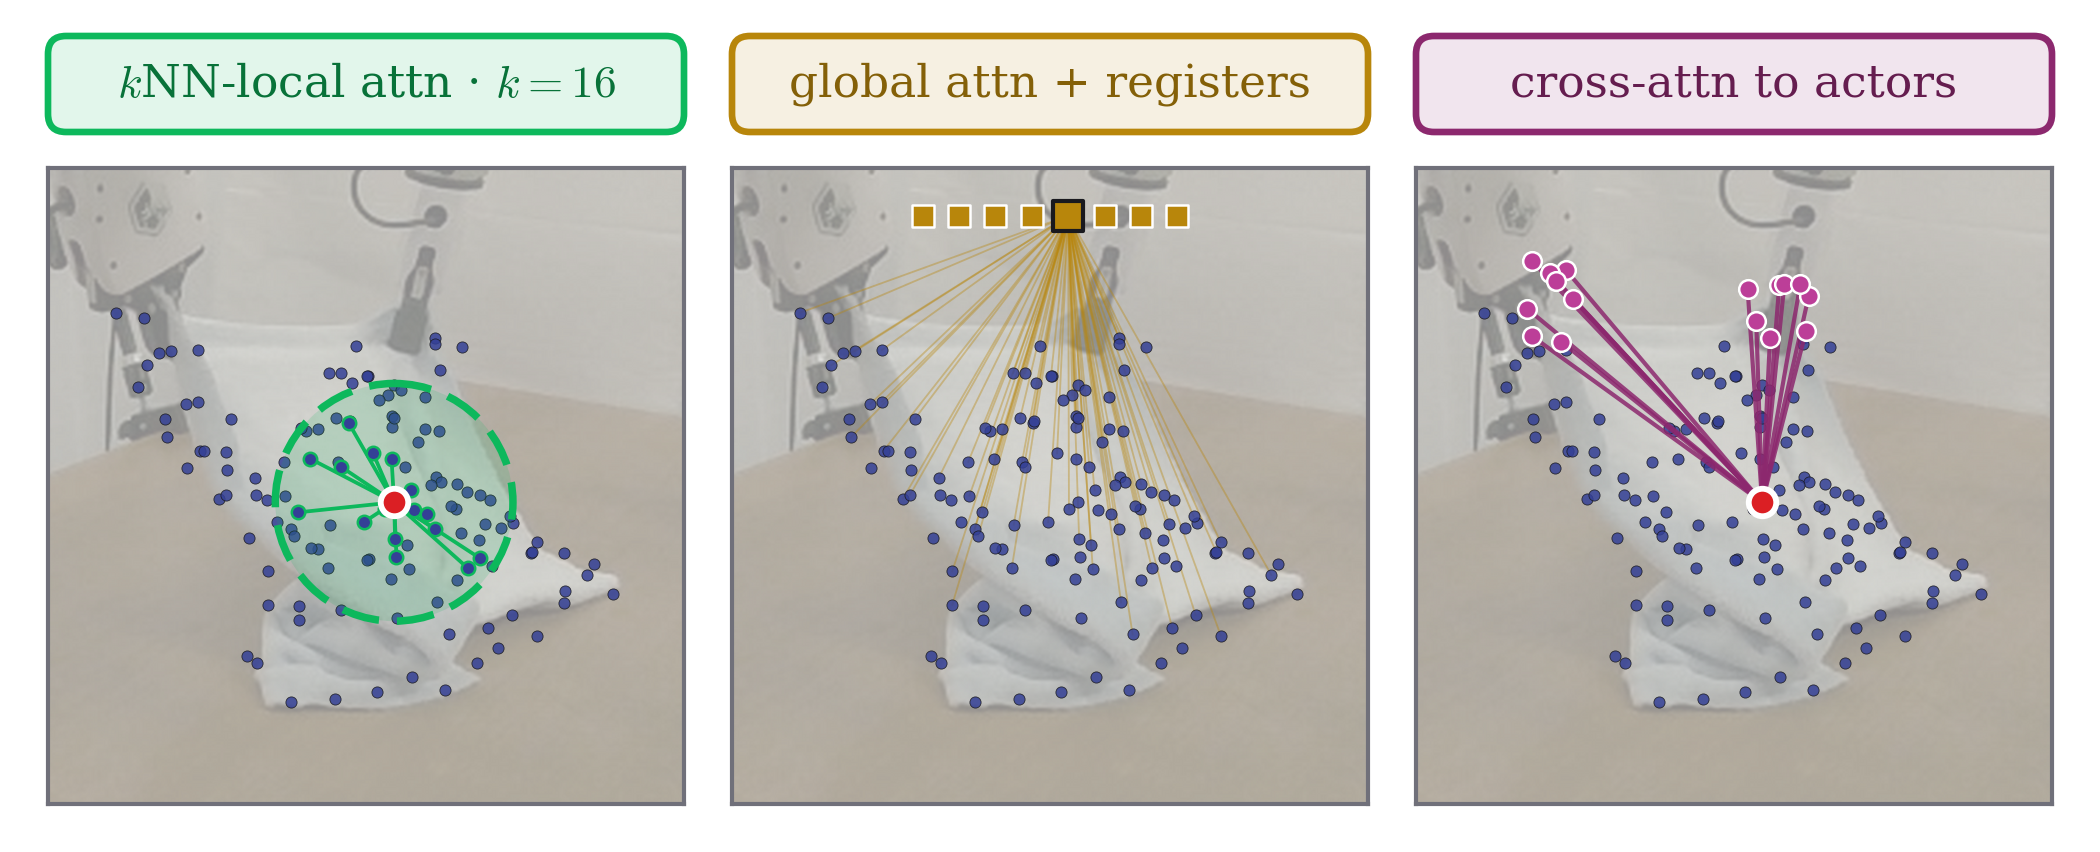
The state is a persistent set of 3D points on the object and on the end-effector. A diffusion transformer denoises the next window of point positions from their recent history and the commanded end-effector motion, and one architecture with one training recipe covers rigid, articulated, and deformable objects.
Simulation rollouts
Three held-out interactions per regime, every frame of the free-running rollout, columns in Table I order with ground truth rightmost. Ground truth is blue, predictions orange, the end-effector magenta and the cabinet's actuated part gold. The labelled history frames are the conditioning every model receives, identical in every column. Each card holds the paper's own interaction second, at the median of PointCast's error over the evaluation pool, between its two nearest neighbours in that ranking. The hardest tenth of each simulated pool is in the Limitations section.
Real-world rollouts
Three test episodes per PGND-benchmark category, all 40 frames each, with the photograph as ground truth. Every prediction column is the episode's pre-interaction Gaussian splat advected by that method's predicted point motion, the end-effector marked in magenta. Rope and box appear here beyond the four categories the paper shows. Episodes are chosen as in the simulation section, by PointCast's step-30 error over the category, and the hardest tenth of each is in the Limitations section. Photographs and splats come from the PGND release.
Zero-shot rollouts
The paper's zero-shot gallery, every frame. Simulation checkpoints are applied with no real training data to four captures whose motions match the training actions, the Push-T replay of Diffusion Policy, Franka block pushes, rope with multi-view tracks, and cloth grasp lifts. Push-T and Franka are point renders carrying the pool's actor points. Rope and cloth are splats whose ground truth is the photograph, with the recorded end-effector drawn. On the two point rows the tracked ground truth is low-pass filtered along time for display only, Savitzky-Golay over 7 frames, because those raw tracks reverse each point's direction every frame, capture noise rather than object motion. Every score on this page and in the paper uses the unfiltered tracks. Filtering them would move the error by about a tenth of a percent. Each card offers three windows, the paper's own shown second. Push-T and Franka take their neighbours from PointCast's error ranking. Rope and cloth take theirs from the windows a registration and a bind-frame splat fit cover and whose recorded end-effector is calibrated onto the object, because on most of these captures the logged tip sits several centimetres from the grasp. The hardest tenth of the two point-rendered captures is in the Limitations section.
Planning with the world model
PointCast frozen inside sampling-based MPC, one network evaluation per window. Three episodes per task, re-rendered from the stored simulator states, showing the object, the goal point set and the end-effector on its executed path. The pushing clips replay every simulator frame, which keeps the pusher's approach between pushes continuous, and the others show one frame per executed window. Every clip is a fresh re-run rather than the scored episode, because the planner draws unseeded noise, and every number quoted is that clip's own. The dragging clips stop three windows after the task's success criterion is first met while their scored runs continue to a fixed budget. The pushing and sequential clips run their whole episode.
Every arm on the same episode
The same planner, cost, budget, seed and goal for every rollout model, and only the model changes: random actions, AdaptiGraph, PGND, PTv3, ParticleFormer and PointCast, in the order every table on this page uses. One frame per executed window, the full budget, one camera per task. A column is marked from the first window at which it meets the task's success rule. Each task offers three episodes, and every clip is an illustrative re-run of the scored configuration rather than a scored episode, because the flow-matching arms draw unseeded noise. On the sequential task the release and the crossing between stages are a fixed trajectory identical for every model, which means the arms plan each stage rather than the sequence.
Error over replanning steps, and what a step costs
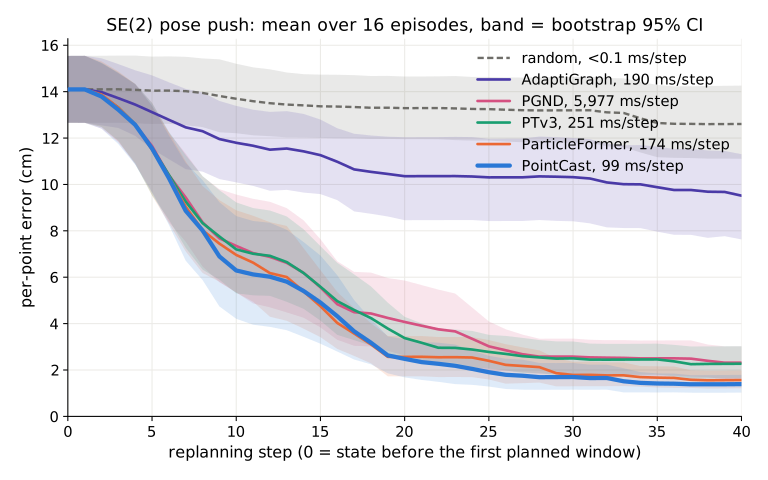
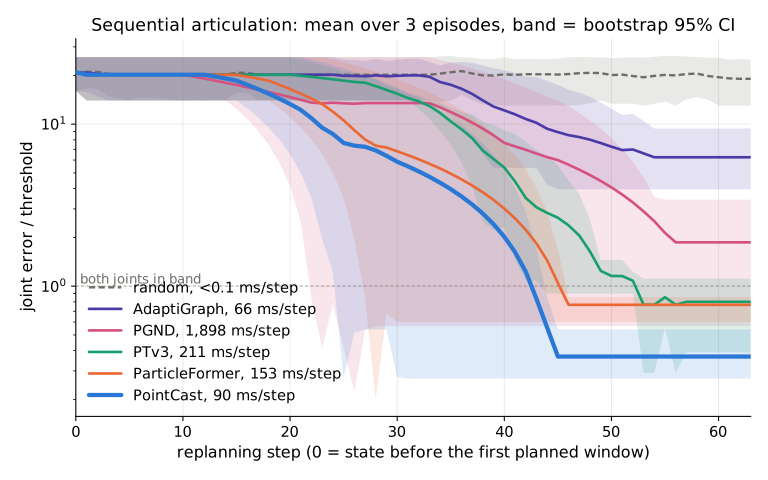
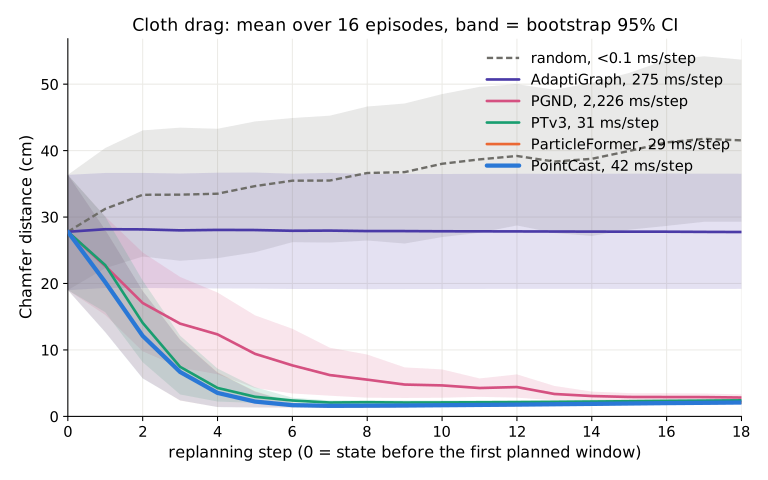
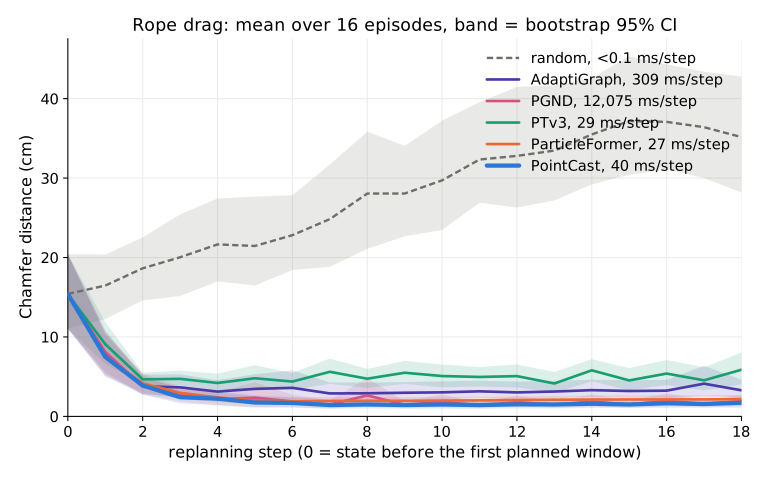
The scored campaigns behind Table V, read window by window: the mean goal error over the 16 episodes at every replanning step, one curve per arm, with a bootstrap 95 percent confidence band, and each arm's mean planning time per step in the legend. Step 0 is the state before the first planned window, and the last point of every curve is that arm's Table V cell. Sequential articulation has no per-window record in its campaign, and its curve comes from the three recorded comparison episodes above (seeds 2, 12 and 9) on the unitless joint error over threshold, log scale, with 1.0 as the line where both commanded parts are inside their thresholds; the three scripted transit windows count as steps, and no campaign number is read from that curve.
| Task | N | Quantity | random | AdaptiGraph | PGND | PTv3 | ParticleFormer | PointCast (ours) |
|---|---|---|---|---|---|---|---|---|
| SE(2) pose push | 32 | ms per replanning step | <0.1 | 189.6 | 5,977.0 | 250.7 | 173.9 | 99.3 |
| s per episode | <0.01 | 7.6 | 239.1 | 10.0 | 7.0 | 4.0 | ||
| Sequential articulation | 16 | ms per replanning step | <0.1 | 66.0 | 1,898.1 | 211.2 | 153.2 | 89.8 |
| s per episode | <0.01 | 3.9 | 69.9 | 8.1 | 5.2 | 2.8 | ||
| Cloth drag | 8 | ms per replanning step | <0.1 | 274.9 | 2,226.1 | 31.3 | 28.9 | 41.7 |
| s per episode | <0.01 | 4.9 | 40.1 | 0.6 | 0.5 | 0.8 | ||
| Rope drag | 8 | ms per replanning step | <0.1 | 308.9 | 12,075.4 | 29.0 | 26.6 | 39.6 |
| s per episode | <0.01 | 5.6 | 217.4 | 0.5 | 0.5 | 0.7 |
Planning wall-clock of the scored campaigns behind Table V, measured on one RTX 4090 with the model rollout batched over the N candidates (N = 32 for the pose push, 16 for sequential articulation, 8 for the drags), which makes a step not comparable across tasks. PointCast plans fastest per step on the pose push and the sequential task; ParticleFormer and PTv3 are faster per step on the two drags. PGND's time is dominated by the exchange with its separate server process, not by model compute. One campaign per cell, order of magnitude only.
Limitations
The clips below are the hardest tenth of each evaluation pool, where the model is weakest, rendered the same way as everything else on this page.
Supplementary tables
Comparisons that did not fit the paper, with their protocol notes.
Planning: the four-task table with its random-action floor
| Task | Metric | init | random | AdaptiGraph | PGND | PTv3 | ParticleFormer | PointCast (ours) |
|---|---|---|---|---|---|---|---|---|
| SE(2) pose push† | per-point (cm) | – | 12.61 [17.32] | 9.52 [14.34] | 2.31 [4.09] | 2.27 [4.06] | 1.57 [2.49] | 1.39 [2.62] |
| Sequential articulation, first part | part err (cm) | – | 18.32 [33.76] | 7.97 [23.35] | 2.25 [6.16] | 0.72 [1.52] | 0.88 [1.41] | 0.42 [0.67] |
| Sequential articulation, second part | part err (cm) | – | 16.86 [30.45] | 2.67 [3.27] | 0.38 [0.84] | 0.97 [1.38] | 0.41 [0.93] | 0.38 [0.97] |
| Cloth drag | Chamfer (cm) | 27.8 | 41.54 | 27.75 [53.26] | 2.83 [4.07] | 2.41 [3.06] | 2.08 [2.66] | 2.09 [2.66] |
| Rope drag | Chamfer (cm) | 15.4 | 35.16 | 3.28 [3.96] | 1.91 [3.74] | 5.87 [10.85] | 2.16 [3.34] | 1.71 [3.44] |
†The SE(2) row is planned three windows ahead; the other three are planned one window ahead, which is what the rest of this table and the clips above use. On that task one window is myopic: the pusher moves at most 3 cm per window against a 17 cm block, so walking around it to a better contact face pays nothing within the horizon. Planning three ahead is a significant improvement for PointCast (p = 0.008) and PTv3 (0.018), and not a significant one for AdaptiGraph, ParticleFormer and PGND. The random floor, which ignores the plan, keeps the same mean at both horizons, which is the control. It costs two to five times the planning time. Mean final distance [p90] over 16 episodes per task; init is the starting distance, best in bold, second underlined. The sequential articulation task scores each commanded part against its own goal at the final frame and reports them separately, never pooled; its success column and the rest of its protocol are in the next table. PointCast is significantly better than PTv3 on the SE(2) task taken alone (p = 0.029) and than PGND (0.005), AdaptiGraph and the random floor. It is not significantly different from ParticleFormer on that task at either horizon (1.39 vs 1.57 cm, better on 9 of 16, p = 0.632; planned one window ahead, 2.63 vs 2.53, better on 5 of 16, p = 0.274). Sixteen episodes per task cannot show two models equal either. The planner is stochastic and our own one-window cell spans 1.93 to 2.63 cm across three runs of identical settings, so a margin under about 0.7 cm on this task is not a ranking.
Sequential articulation: the three scores, the door / drawer split, and the protocol
The task commands two of the two-to-four movable parts of a mixed cabinet, in a sampled order, over the same scenes and with the same per-part metric as the single-joint version it replaces, which commanded one part and which every learned model solved to inside a centimetre. A stage ends when its joint is inside its own threshold and has stopped moving, or at a budget of 30 windows. Between the stages the grasp is released, the end-effector retracts to a 10 cm standoff, crosses to the next handle and approaches it, over 15 frames that are the same for every model and that no model plans. Every model observes those frames, so each enters its second stage with a history that contains the end-effector arriving. That the crossing is scripted is a result rather than a convenience: a point set does not record whether a grasp is closed, so a retract looks like a pull and the models keep predicting that the released part follows the end-effector. We fixed that test and its bar before building the task, the models' one-window error rose about fivefold across a release, and the test failed, which is why no model is asked to plan through one. Sixteen episodes, seeds 0 to 15, the checkpoints and inference settings of Table I, simulation only.
Doors are scored in radians against a 0.05 rad threshold and drawers in metres against 1.5 cm, so the pass criterion is type-normalized; the distances below are per-part point distances and are directly comparable within a column.
| Score | random | AdaptiGraph | PGND | PTv3 | ParticleFormer | PointCast (ours) |
|---|---|---|---|---|---|---|
| Sequence success | 0% | 12% | 75% | 75% | 88% | 100% |
| Reached the first stage | 0.06 | 0.25 | 1.00 | 0.94 | 0.94 | 1.00 |
| Reached the second stage | 0.00 | 0.31 | 1.00 | 0.88 | 1.00 | 1.00 |
| First part, end of sequence (cm) | 18.32 | 7.97 | 2.25 | 0.72 | 0.88 | 0.42 |
| Second part, end of sequence (cm) | 16.86 | 2.67 | 0.38 | 0.97 | 0.41 | 0.38 |
| Planning cost (s / episode) | – | 3.9 | 69.9 | 8.1 | 5.2 | 2.8 |
Three scores, reported side by side and never pooled into one: which stages were reached, how far every commanded part sits from its own goal at the final frame, and whether both are inside their thresholds simultaneously at the end. They disagree, which is why they are kept apart. PTv3 ends the first stage closer than ParticleFormer and still succeeds less often. PGND is the sharper case: it reaches both stages on all sixteen episodes, the only model besides ours to do so, and still loses four of them, because the first part moves afterwards. No pooled test is quoted for this task: dropping the single-joint version from the pool moves ours against ParticleFormer from p = 0.462 to 0.033, and it crosses 0.05 only because the one task where ParticleFormer led us left the pool.
| Model | First stage, door | First stage, drawer | Second stage, door | Second stage, drawer |
|---|---|---|---|---|
| random | 14.02 | 23.84 | 11.28 | 26.16 |
| AdaptiGraph | 4.63 | 12.26 | 3.40 | 1.46 |
| PGND | 0.13 | 4.97 | 0.16 | 0.74 |
| PTv3 | 0.49 | 1.02 | 0.87 | 1.13 |
| ParticleFormer | 0.47 | 1.41 | 0.36 | 0.49 |
| PointCast (ours) | 0.27 | 0.62 | 0.31 | 0.48 |
- Drawers are harder than doors for every model, the one trend that holds across the whole table. Ours has the smallest gap between the two (0.27 against 0.62 cm on the first stage); ParticleFormer's first-stage drawer error is three times its door error and PGND's is thirty-eight times.
- PGND has the best door cells in the table and the worst drawer cell outside AdaptiGraph and the floor. All four of its lost episodes have a drawer as the first stage, and every one of its door first stages ends where it was put. In two of the four the stage used its entire 30-window budget, so the grasp opened while the drawer was still travelling and it coasted. The other two ended stopped and moved anyway; the obvious suspect is the end-effector touching the protruding drawer while it works the other joint, but nothing here measures that and it should not be written up as established.
- The first part staying put is scored, not assumed. Over the second stage it moves 0.03 cm on average for ours and 0.12 to 0.39 cm for ParticleFormer, PTv3 and AdaptiGraph, all far inside the 1.5 cm drawer threshold. PGND is the exception at 1.85 cm, and it is the one model whose success rate is not explained by which stages it reached.
- No model is given a brake. A scripted oracle needed one: its first version let go of parts still travelling at about 10 cm/s and lost five of sixteen episodes to the coast alone. The planned models choose every action, including the ones near the goal, so a model whose prediction carries the part's momentum can command the counter-pull itself. That is the capability this task is built to expose.
- Sixteen episodes, one scene distribution, and the planner is not reproducible run to run (its spread on a same-checkpoint re-run is 2.2% on the rope task, with no episode identical). The 100% to 0% spread on sequence success is far outside that; the sub-centimetre differences between the leading models are not.
Real benchmark: per-episode standard deviations and a horizon-mean variant of Table II
The paper's Table II prints means only. The table below repeats those means with the per-episode standard deviation (ddof = 0) of every cell, in mm. The metric is the benchmark's own protocol, the mean displacement error at the end of its 3 s horizon (step 30, raw frame 99).
| Method | Cloth | Rope | Box | Bread | Paper bag | Sloth |
|---|---|---|---|---|---|---|
| PTv3 | 42.24 ± 35.91 | 25.85 ± 12.55 | 21.76 ± 6.29 | 22.37 ± 11.29 | 21.40 ± 10.37 | 48.43 ± 21.64 |
| ParticleFormer | 31.65 ± 17.76 | 24.10 ± 17.20 | 24.54 ± 5.11 | 22.61 ± 11.72 | 18.62 ± 22.53 | 44.32 ± 19.40 |
| PGND (native) | 44.49 ± 21.42 | 39.14 ± 31.75 | 27.79 ± 11.60 | 20.33 ± 11.42 | 16.16 ± 6.06 | 42.94 ± 18.09 |
| PointCast (ours) | 32.20 ± 20.77 | 15.83 ± 9.40 | 23.51 ± 7.65 | 18.65 ± 12.18 | 11.64 ± 5.59 | 37.83 ± 18.88 |
| n (test episodes) | 40 | 40 | 20 | 20 | 20 | 20 |
Best in bold, second underlined, as in the paper. The marks rank the means and no significance claim is printed on them: on cloth the 0.55 mm between PointCast and ParticleFormer stands against standard deviations of 20.77 and 17.76 mm, and on box the 4.28 mm between PointCast and PGND against 7.65 and 11.60 mm. ParticleFormer's paper-bag cell, 18.62 ± 22.53, carries a known divergence in its tail episodes. PGND's paper reports box as 22.0 ± 7.0 mm from its own run, where the released checkpoint scores 27.79 at the same horizon end; the other five categories reproduce the published values within 1 mm.
Horizon-mean variant
Table II scores the end of the 3 s horizon, which is the benchmark's protocol. The variant below is the mean over the first 30 horizon steps, derived from the stored per-episode curves, mean ± std over episodes (ddof = 0), in mm. PGND's standard deviations are omitted because its stored per-episode curves disagree with its own step-30 score cells on bread and cloth.
| Method | Cloth | Rope | Box | Bread | Paper bag | Sloth |
|---|---|---|---|---|---|---|
| PTv3 | 25.8 ± 21.2 | 16.0 ± 6.9 | 16.4 ± 4.1 | 13.0 ± 6.4 | 15.2 ± 6.2 | 28.9 ± 10.4 |
| ParticleFormer | 19.4 ± 10.1 | 15.4 ± 9.7 | 17.8 ± 3.5 | 13.0 ± 6.2 | 13.8 ± 17.9 | 27.3 ± 10.0 |
| PGND (native) | 24.2 | 21.0 | 17.2 | 11.1 | 11.6 | 25.7 |
| PointCast (ours) | 20.1 ± 12.8 | 9.9 ± 5.1 | 17.3 ± 5.0 | 10.9 ± 6.6 | 8.6 ± 3.6 | 22.9 ± 9.7 |
This variant is not the headline metric because PGND's published values reproduce the horizon-end instant and not the horizon mean: its cloth cell is 44.49 mm at the horizon end against 45 published, and 24.2 mm as the horizon mean. On this variant PointCast has the lower mean than PGND in five of six categories; on box the two are 17.3 and 17.2. The row "+ ParticleFormer loss (rigid)" of the paper's Table IV is the ParticleFormer shape loss added at weight 1.0 to the per-point loss, trained on rigid only; it is not the rigid-projection evaluation flag.
Training budget and timing
Every arm (PointCast, PTv3 and ParticleFormer) trains for 200 epochs of 800 steps at batch size 64, which is 160,000 steps and 10.24 M samples per regime. An epoch is a fixed 800-step unit decoupled from the pool size: with 85% of each pool as training windows, rigid sees its data about 2.5 times at the shared budget and cabinet about 80 times. The simulation test splits are the n row of the paper's Table I (2796 / 1047 / 1119 / 996 interactions for rigid / cloth / rope / cabinet), held out by object; 15% of the remainder is the validation slice used for checkpoint selection.
One predicted window costs 16.2 ms of model compute on one RTX 4090 at batch size one. The pooled 25-step run costs 384.8 ms (23.8×). Free-running rollouts run 18 to 77 times real time at the verified observation rate of 15 Hz. These timings are intra-model only; no cross-method speed comparison is quoted.
Actor template on the real benchmark, and seed variance
The 16 actor points are the simulation's gripper-finger template, a Franka-style two-finger geometry, posed on real data along the benchmark's commanded end-effector trajectory rather than the tracked pose, and carrying no gripper-open distance. On the bimanual PGND categories (cloth, paper bag, box, bread) the 16 points split across the two grippers. PGND's own action input includes the gripper-open distance, which means PGND (native) and PointCast do not read identical actor information in Table II. The caption of the paper's zero-shot gallery (Fig. 6) discloses that the end-effector it draws is the recorded one, not the template the models read.
The per-episode standard deviations in the Table II block above cover episode noise. Seed-level variance, from several training seeds, is deferred to a later supplementary update of this page. The planning run-to-run spread is already disclosed on this page: PointCast's one-window pose-push cell spans 1.93 to 2.63 cm across three runs of one configuration, a 0.70 cm spread, and no row of the planning table above separates its two leading arms by more than 0.30 cm.
Planning evaluation: success criterion, horizon and candidate count
The paper's Table V ranks the arms on the mean final distance and prints no success rate. The success criterion used in the campaign is a 3 cm threshold, every point within 3 cm of its goal on the pose push; the sequential and drag criteria are stated with their tables and clips above. The per-task lookahead (one window everywhere, three on the SE(2) pose push) rests on a screening run of PointCast alone, 16 seeds per task, each task at its shipped flags with only the horizon changed. Three windows help the pose push (2.63 to 1.39 cm, better on 13 of 16 seeds, p = 0.008, and every learned arm's mean improves in the six-arm comparison of the planning table), leave cloth drag unchanged (p = 0.376), and make rope drag worse on every one of the 16 seeds (1.46 to 5.18 cm, p = 0.000); horizon 4 was worse than horizon 3 on the pose task. The screening run is separate from the scored campaign, and its own one-window rope cell, 1.46 cm, differs from the table's 1.71 cm; the planner's run-to-run spread is recorded under the planning table. The number of sampled candidates is fixed across models at N = 32 on the push task, 16 on the cabinet task and 8 on the drag tasks; no sweep over N exists.
Hyperparameters
Read from the config of the four shipped checkpoints; all four agree unless a value names the regime.
| Setting | Value |
|---|---|
| Architecture | |
| DiT blocks | 8 |
| Width | 256 |
| Attention heads | 8 |
| Self-attention | alternating kNN-local and global, k = 16 |
| Register tokens | 8, excluded from local attention and dropped at the output |
| Cross-attention | to the end-effector tokens |
| Position embedding | 3D rotary, base frequency 100 |
| Point embedding | 8 Fourier frequencies |
| Dropout | 0 |
| Parameters | 19.8M |
| State and window | |
| Object points K | 128 |
| End-effector points M | 16 |
| History | 5 frames |
| Window F | 5 future frames |
| Frame stride | 1 for rigid and cabinet, 4 for cloth and rope |
| Normalisation | per interaction, by the object's bounding-box diagonal at the first frame; no centering |
| Objective | |
| Loss | flow matching, sample (clean-window) prediction |
| Noise level τ | logit-normal with mean 0 and std 1, shifted toward the noisy end with shift 3.0 |
| Velocity term weight | 0.1 |
| Distance-preservation prior | weight 0.01 over the 6 nearest neighbours, edge weight exp(−γd2) with γ = 2000 (d in metres); part-aware neighbours on the cabinet only |
| Sampler at deployment | S = 1 Euler step |
| Training | |
| Schedule | 200 epochs of 800 steps at batch size 64 (160,000 steps, 10.24 M samples per regime) |
| Learning rate | 1e-4, cosine decay to 1 percent |
| Precision | bfloat16 autocast |
| Seed | 42 |
| Augmentation | random yaw rotation; state noise 5 mm; history-frame noise up to 0.05 with probability 0.5 |
| Wall-clock | about 7 hours on one A100 or H100 |
| Baselines under the same protocol | |
| PTv3 | the PointWorld backbone driven by the same objective and one-step sampler, with the end-effector points appended to its point set and every object point given its offset to the nearest end-effector point; 19.5M parameters |
| ParticleFormer | three self-attention layers of width 728 with 8 heads over object and end-effector tokens, a per-token displacement head, deterministic, one frame at a time, trained on an equal (α = 0.5) mix of symmetric Chamfer and Hausdorff distance with no material input; its element-by-element mapping is in the last block of this section |
Additional ablation rows not printed in the paper
These rows were cut from Table IV for the page limit or moved here by ruling. They were trained and scored on the training lineage that preceded the shipped recipe (constant learning rate, the same architecture and pools). Their base row is therefore a different checkpoint from the shaded row of Table IV, and the two tables are not compared cell to cell. Each row is read against its own base, as in the notes. All rows are scored at S = 1 on the pools of Table I, with the cabinet column the actuated joint.
| Variant | Rigid | Cloth | Rope | Cabinet* |
|---|---|---|---|---|
| Number of control points (K = 128 is the base of this lineage) | ||||
| K = 32 | 28.07 | 41.38 | 15.09 | 12.82 |
| K = 256 | 25.61 | 28.45 | 16.38 | 9.13 |
| K = 512 | 30.26 | 31.95 | 18.27 | 18.49 |
| Architecture | ||||
| no register tokens | 27.08 | 30.48 | 16.68 | 9.56 |
| local-only self-attention | 26.54 | 31.26 | 16.34 | 8.92 |
| global-only self-attention | 27.54 | 31.01 | 16.41 | 7.89 |
| Recipe and checkpoints | ||||
| no part-rigidity term (cabinet) | – | – | – | 7.12 |
| joint checkpoint, 1× budget | 34.08 | 42.73 | 19.32 | 62.61 |
- Control points. Against this lineage's K = 128 base, K = 256 is better on cloth (−10.4%) and rope (−1.9%) and worse on rigid (+1.2%); K = 32 and K = 512 are worse on the cabinet joint. K = 128 is a compromise across regimes, not a per-regime optimum.
- Register tokens. Removing them is +7.0% on rigid and −4.0% on cloth by paired test, and a tie on rope (−0.1%).
- Self-attention pattern. Against the alternating base, local-only is +4.9% / −1.5% / −2.1% / +7.0% and global-only +8.8% / −2.3% / −1.7% / −5.3% on rigid / cloth / rope / cabinet joint. Both exceed the three-seed spread on rigid alone (spread 3.2% rigid, 4.5% cloth, 19% rope, 18.2% cabinet joint). The pattern is load-bearing on rigid and inside the spread elsewhere.
- Part-rigidity term. A per-part rigid-alignment term the earlier recipe carried on the cabinet; it is not in the shipped recipe.
- Joint checkpoint at 1× budget. One checkpoint on all four pools at the per-regime budget, +34.7% / +34.6% / +15.7% on rigid / cloth / rope against that lineage's per-regime cells. Its checkpoint selection was made on rigid alone, and the 4×-budget row of Table IV, selected on a regime-balanced validation slice, supersedes it.
Real benchmark with AdaptiGraph at its gate, zero-shot with AdaptiGraph, simulation checkpoints on the PGND benchmark, ParticleFormer reimplementation
The comparisons below did not fit the paper or were ruled out of it. They are complete tables with their own protocol notes, kept here so that every method appears on every benchmark.
Real benchmark with AdaptiGraph, every method starting at AdaptiGraph's gate
AdaptiGraph's released evaluation starts its rollout at the first frame in which the end-effector moves (its gate) and reaches the benchmark's scored frame in only part of the episodes. Here every method starts predicting at that gate: the last observed frame is the one before it, and the target is H = 10 predicted frames after it. Episodes whose target falls past the end of the recording are excluded. Values are mean mm over all kept episodes; the AdaptiGraph column covers only the episodes its own rollout reaches (nAG) and is paired against PointCast on those episodes. PGND is scored on its own particle subset by its own driver. The horizon is 10 predicted frames after the gate, not Table II's 29 from the episode start, and these values are not Table II cells.
| Category | n | PointCast | ParticleFormer | PTv3 | PGND | AdaptiGraph (nAG) | PointCast vs AdaptiGraph, p |
|---|---|---|---|---|---|---|---|
| cloth | 40 | 18.07 | 16.22 | 20.94 | 18.85 | 20.25 (24) | 0.47 |
| rope | 39 | 9.65 | 12.62 | 14.45 | 15.16 | 23.37 (26) | 6.0e-8 |
| box | 20 | 13.68 | 14.27 | 13.96 | 16.43 | 14.05 (13) | 0.79 |
| bread | 20 | 8.29 | 9.93 | 10.71 | 9.14 | 11.81 (11) | 0.019 |
| paper bag | 20 | 7.83 | 15.10 | 11.05 | 9.63 | 10.47 (12) | 0.13 |
| plush | 19 | 21.44 | 25.03 | 24.56 | 20.15 | 29.97 (16) | 0.011 |
| Category | vs ParticleFormer | vs PTv3 | vs PGND |
|---|---|---|---|
| cloth | 14/40, 0.070 | 30/40, 0.0083 | 25/40, 0.31 |
| rope | 25/39, 0.0012 | 31/39, 1.5e-5 | 33/39, 2.5e-6 |
| box | 14/20, 0.12 | 12/20, 0.55 | 12/20, 0.22 |
| bread | 12/20, 0.11 | 14/20, 0.040 | 10/20, 0.41 |
| paper bag | 14/20, 0.036 | 15/20, 0.012 | 17/20, 0.015 |
| plush | 14/19, 0.012 | 15/19, 0.016 | 9/19, 0.57 |
With every method starting at the gate, PointCast has the best mean in four of six categories (rope, box, bread, paper bag), ParticleFormer leads cloth and PGND leads plush. AdaptiGraph is significantly better nowhere, and is significantly worse than PointCast on rope, bread and plush, on the episodes its own rollout reaches.
Zero-shot transfer with the AdaptiGraph column
The four printed columns are Table III. AdaptiGraph is scored on its own motion-gated frame set and reported with the ratio to its own static null in parentheses (a rollout that never moves the object). Its raw mm is therefore not comparable across the row, which is why the paper omits it. On the Push-T row AdaptiGraph's value depends on its radius-estimation setting (35.21 with pooled radii, 37.02 with base radii); the pooled value is printed.
| Capture (n) | PGND | PTv3 | ParticleFormer | PointCast | AdaptiGraph (× own null) |
|---|---|---|---|---|---|
| Push-T replay (70) | 37.27 | 24.67 | 18.07 | 15.35 | 35.21 (0.658) |
| Franka blocks (35) | 75.38 | 60.30 | 72.50 | 52.86 | 68.33 (0.756) |
| Rope (123) | 58.07 | 83.45 | 42.47 | 49.05 | 55.99 (0.862) |
| Cloth (31) | 291.12 | 54.77 | 32.43 | 42.20 | 44.62 (0.966) |
Simulation checkpoints on the PGND benchmark, zero-shot
The cloth and rope simulation checkpoints of Table I, applied with no real data to the PGND benchmark's own 40-episode test splits and scored on the benchmark's metric, the mean displacement error at step 30 in mm. Two protocols: matched cadence keeps the benchmark's frame rate, the same inputs as every Table II arm with only the checkpoint changed; matched operating point re-strides the same episodes until a window carries the end-effector motion of a training window, and scores at the same physical target. Both at the deployed S = 1. The two reference rows are Table II cells.
| Arm | Cloth | Rope |
|---|---|---|
| Simulation checkpoint, zero-shot, matched cadence | 92.45 | 134.33 |
| Simulation checkpoint, zero-shot, matched operating point | 65.25 | 51.87 |
| PointCast trained in-domain (Table II) | 32.20 | 15.83 |
| PGND native (Table II) | 44.49 | 39.14 |
Re-striding to the training operating point closes 45% (cloth) and 70% (rope) of the distance from the matched-cadence cell to the in-domain cell, which places most of the matched-cadence error in the action-distribution mismatch rather than in the geometric interface. Closing the rest requires target-domain episodes, which is what Table II then shows the same architecture doing. One seed per arm; no fine-tuning arm was run.
ParticleFormer reimplementation
ParticleFormer released neither code nor hyperparameters. Our reimplementation follows the paper element by element; the hyperparameters the paper leaves open take the values of our shared training protocol.
| Element | ParticleFormer paper | Our implementation |
|---|---|---|
| Backbone | L = 3 plain full-attention Transformer encoder over all particle tokens; no positional encodings (Sec. 3.2) | Standard Transformer encoder, L = 3, full attention, no positional encoding, no rotary embedding, no kNN mask |
| Token | z(i) = f_proj([x(i), m(i), u(i)]) (Eq. 2) | [position (3), motion (3), type one-hot (2)] through an MLP projection |
| End-effector particles | First-class tokens in the same self-attention | Actor points (with per-point motion) as in-stream tokens; padded slots masked |
| Object motion input | u_obj = 0; Markov, no history or velocity (Eq. 1 and 2) | Object tokens carry motion = 0 and only the last history frame's positions |
| Decoding | Shared per-particle displacement head, x̂ = x + Δx̂ (Eq. 4 and 5) | LayerNorm + Linear(d to 3), clamped, added to the last positions |
| Loss | L = α·CD + (1 − α)·HD (Eq. 6) | α times the symmetric Chamfer distance plus (1 − α) times the Hausdorff distance |
| Training | k-step autoregressive unroll, k = 5, loss over the rollout (Sec. 3.3) | k = 5 unroll, per-step hybrid loss (mean), full backpropagation through the unroll |
| Inference | Deterministic single forward per step | Deterministic head, one forward per rollout window |
Protocol-conformed settings, identical to PointCast and PTv3: K = 128 farthest-point-sampled control points and 16 end-effector points, five history windows, the per-regime frame stride, position normalization, rotation augmentation, state noise, the 0.85 / 0.15 split by object, Adam at learning rate 1e-4 with the cosine schedule, batch 64, 200 epochs, seed 42.
BibTeX
@inproceedings{pointcast2027,
  title     = {PointCast: One World Model for Rigid, Articulated, and Deformable Object Manipulation},
  author    = {Anonymous Authors},
  booktitle = {Submission to the IEEE International Conference on Robotics and Automation (ICRA)},
  year      = {2027},
  note      = {Author information omitted for double-anonymous review}
}